Scientific plotting, built to share.
Drop in the raw file. Build the figure. Send a link. Nobody installs anything.
Free to start · no credit card needed · nothing to install
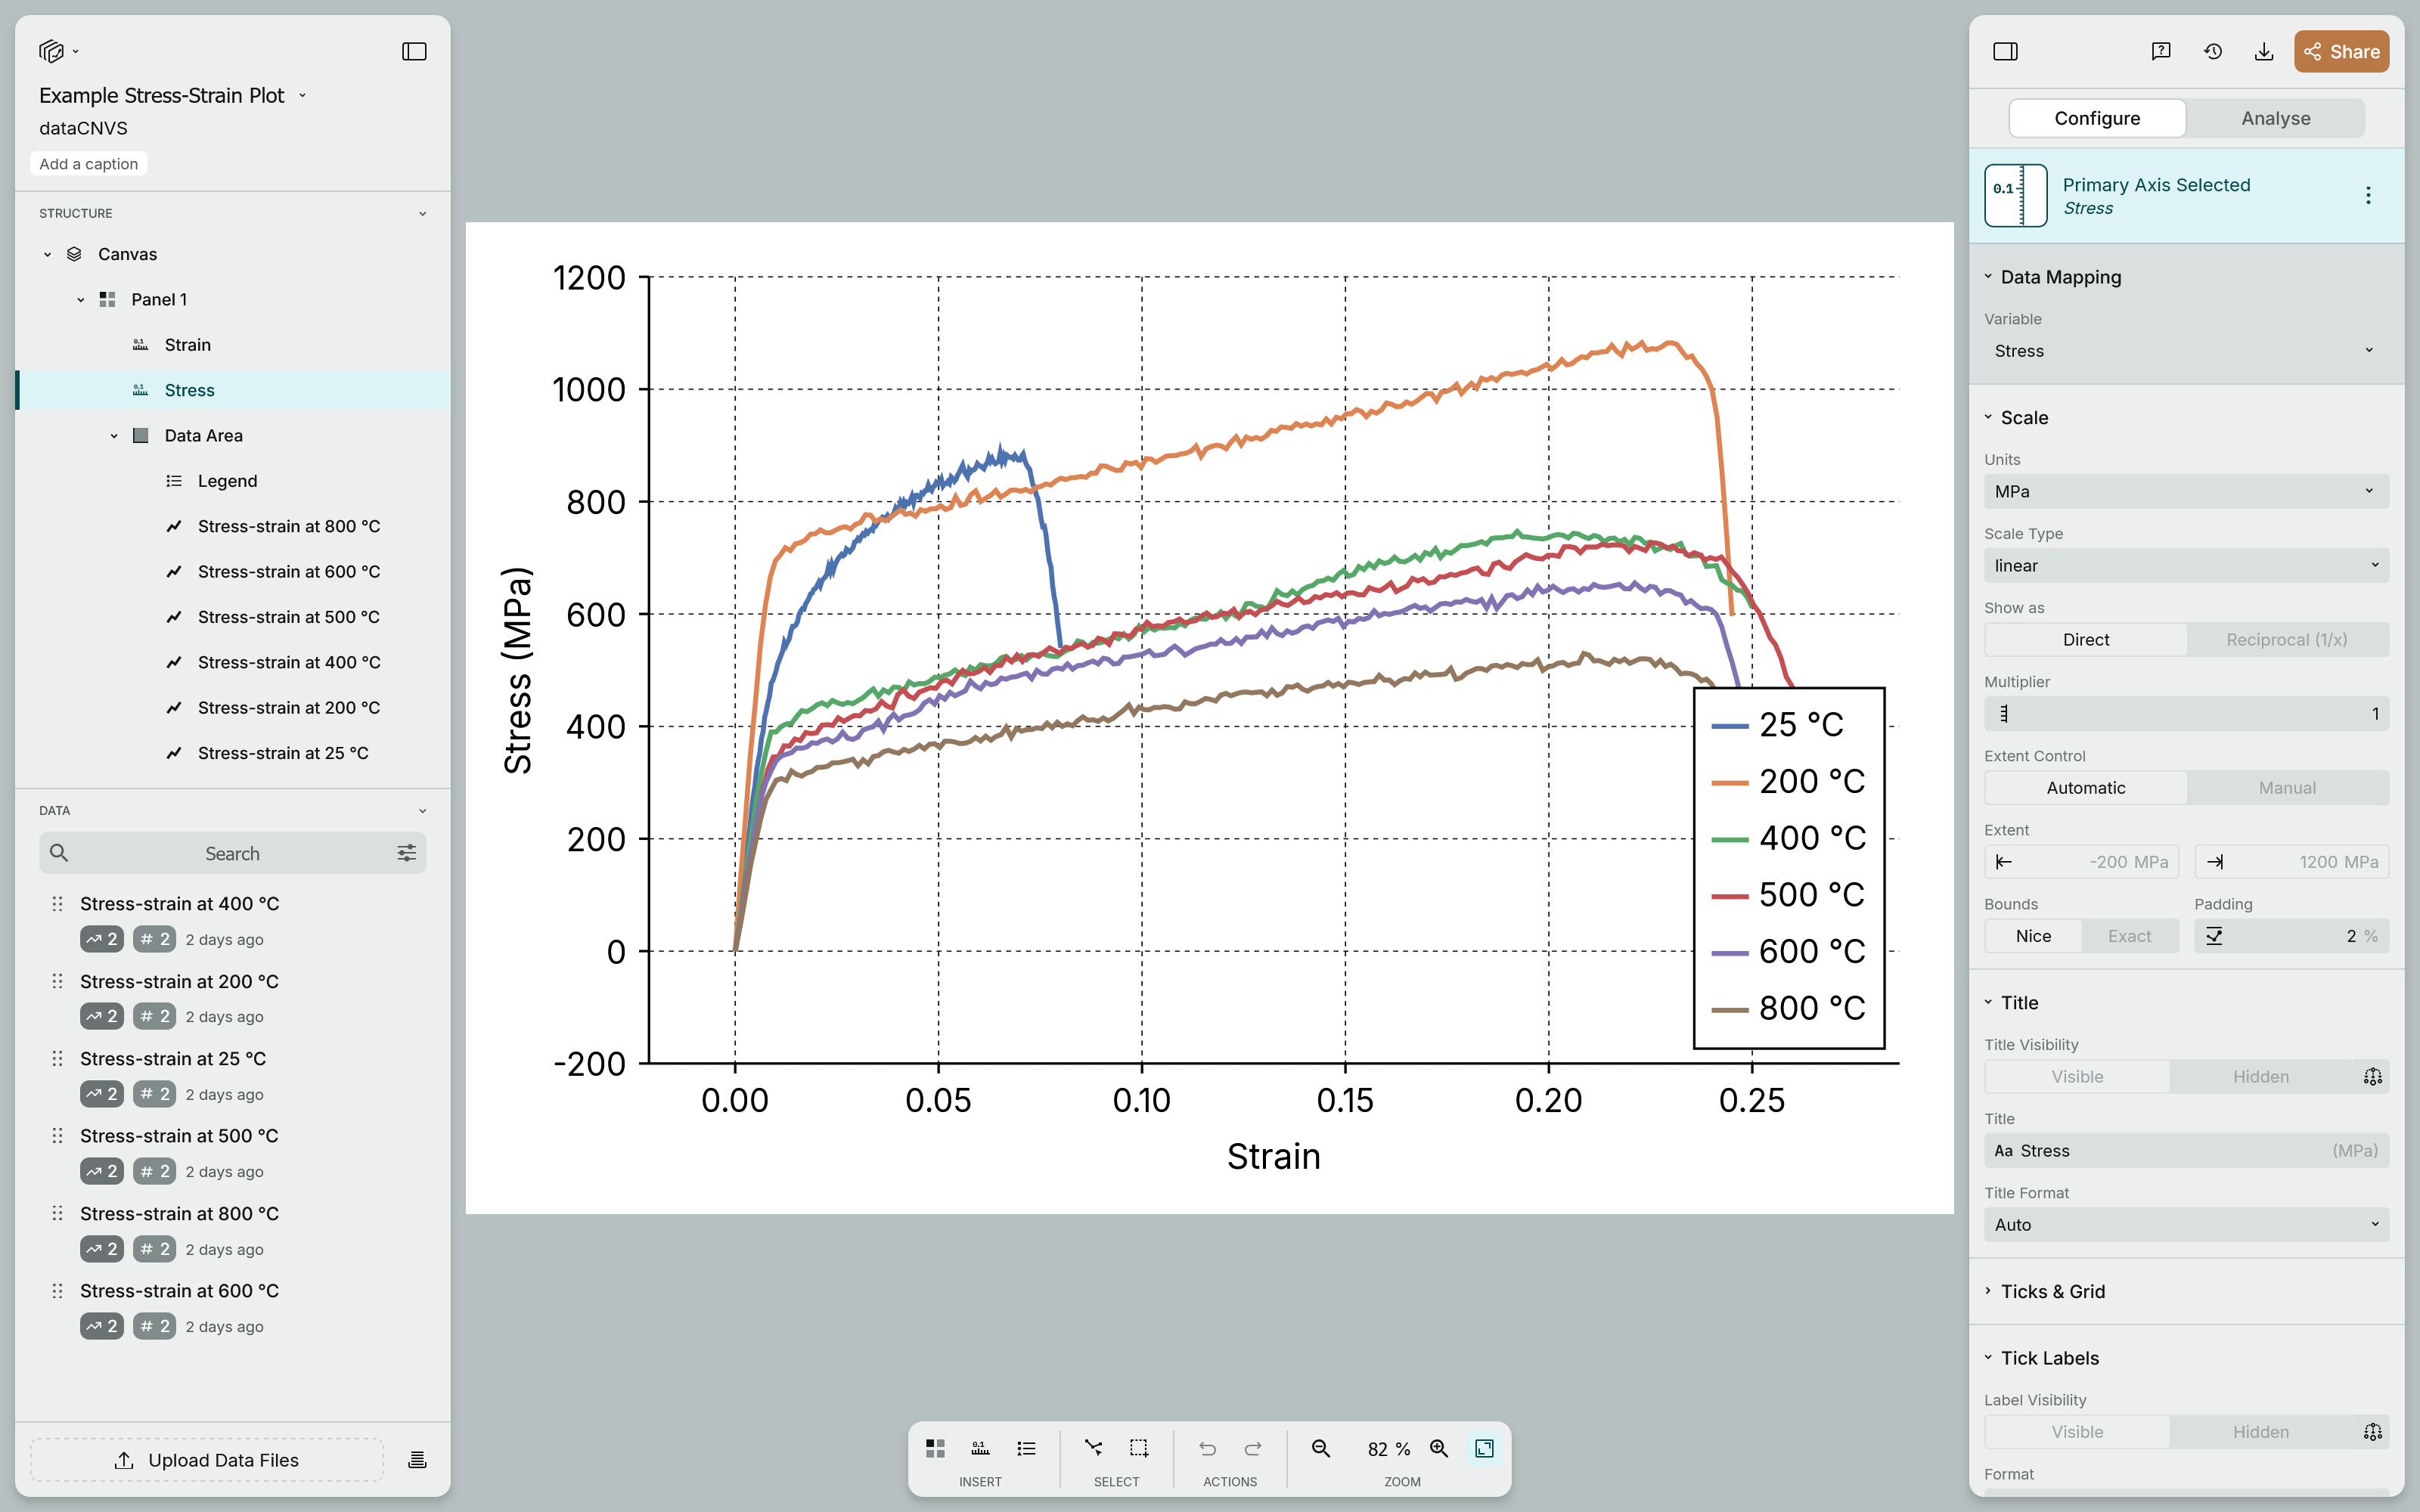
Start from a real canvas.
Every example is a live canvas. Pan it, zoom it. When you find one that looks useful, hit Duplicate and it becomes your copy, and you can swap in your own data.
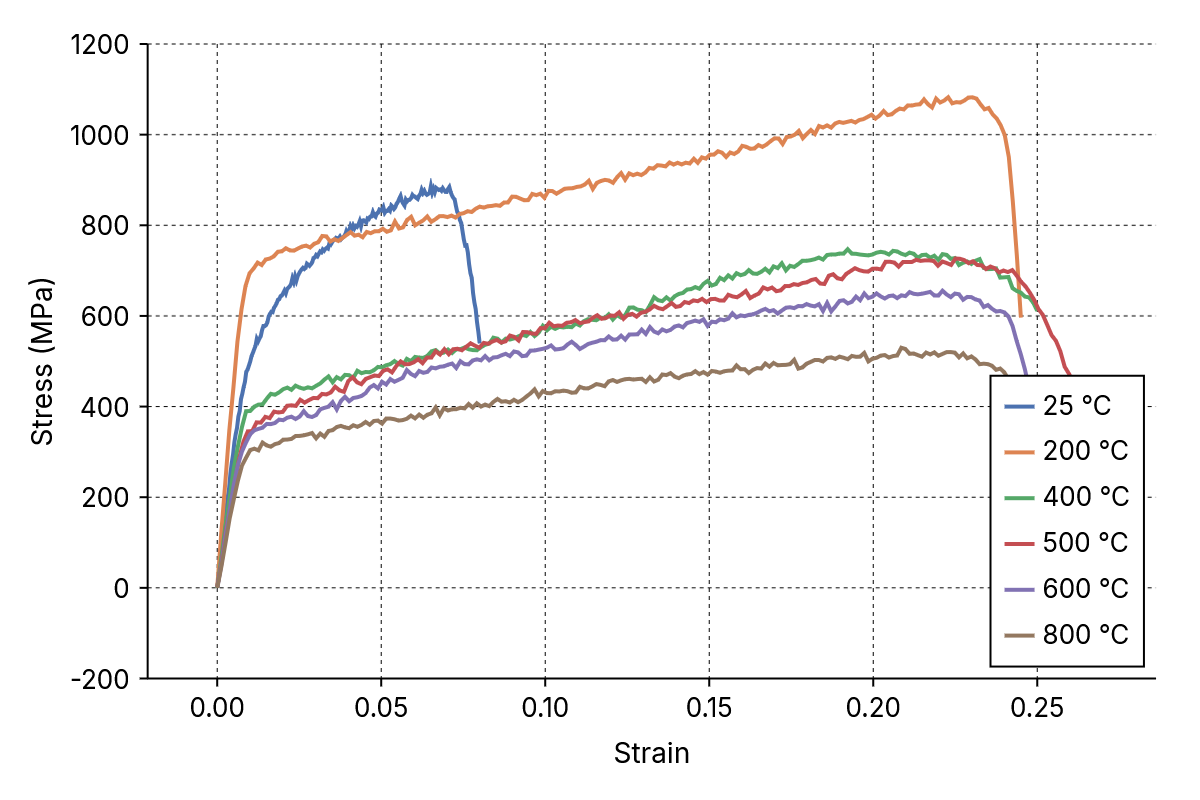
Tensile test
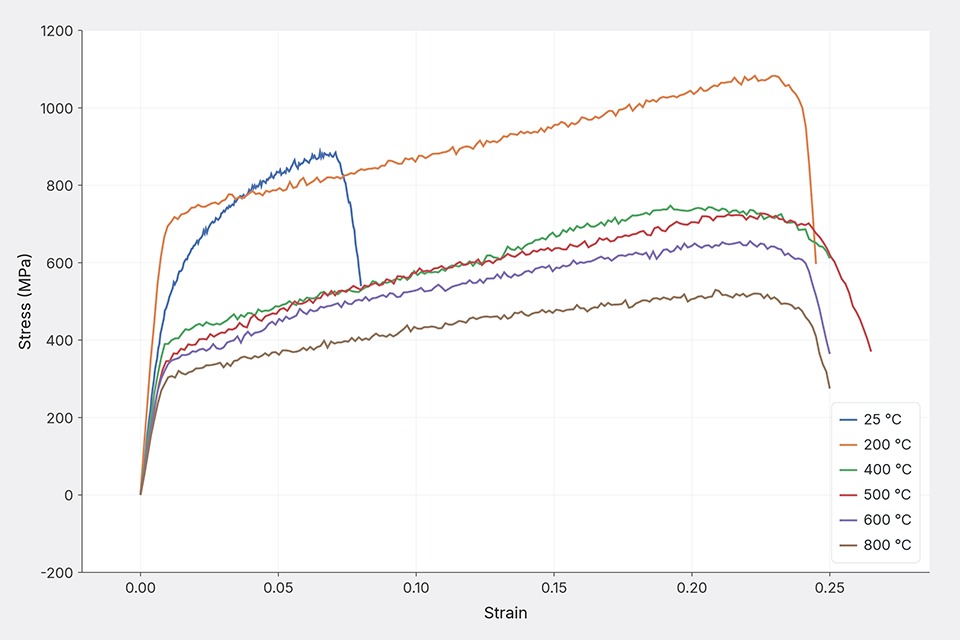
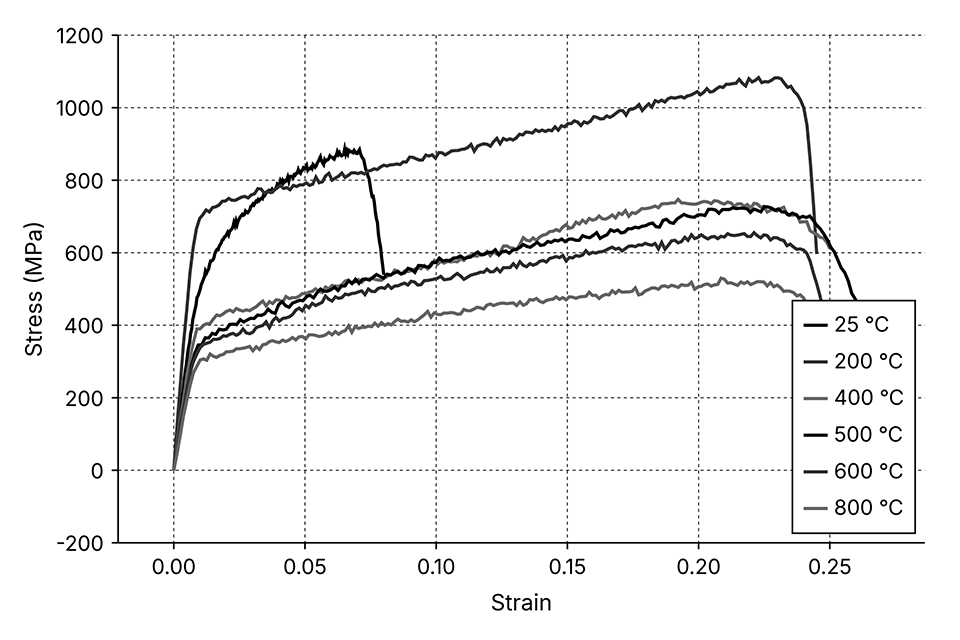
Stress–strain curves from 25 °C to 800 °C, each temperature named in the legend.
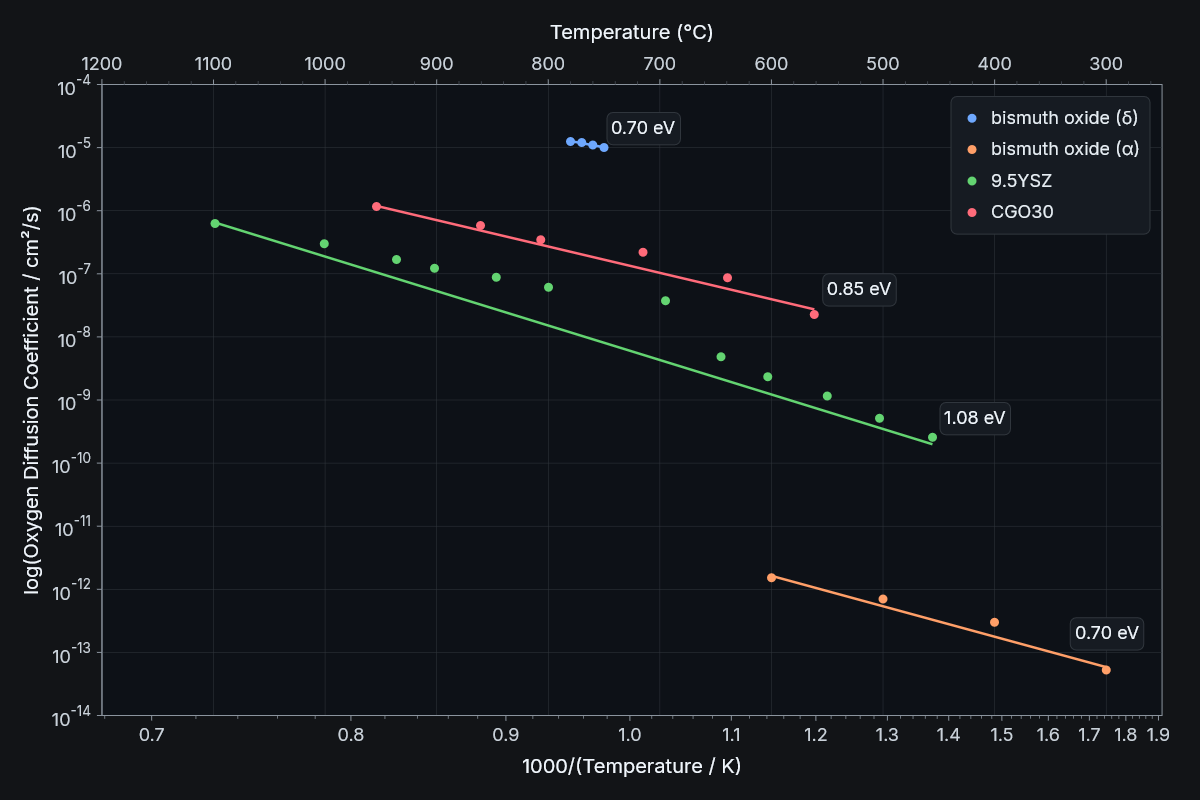
Arrhenius plot
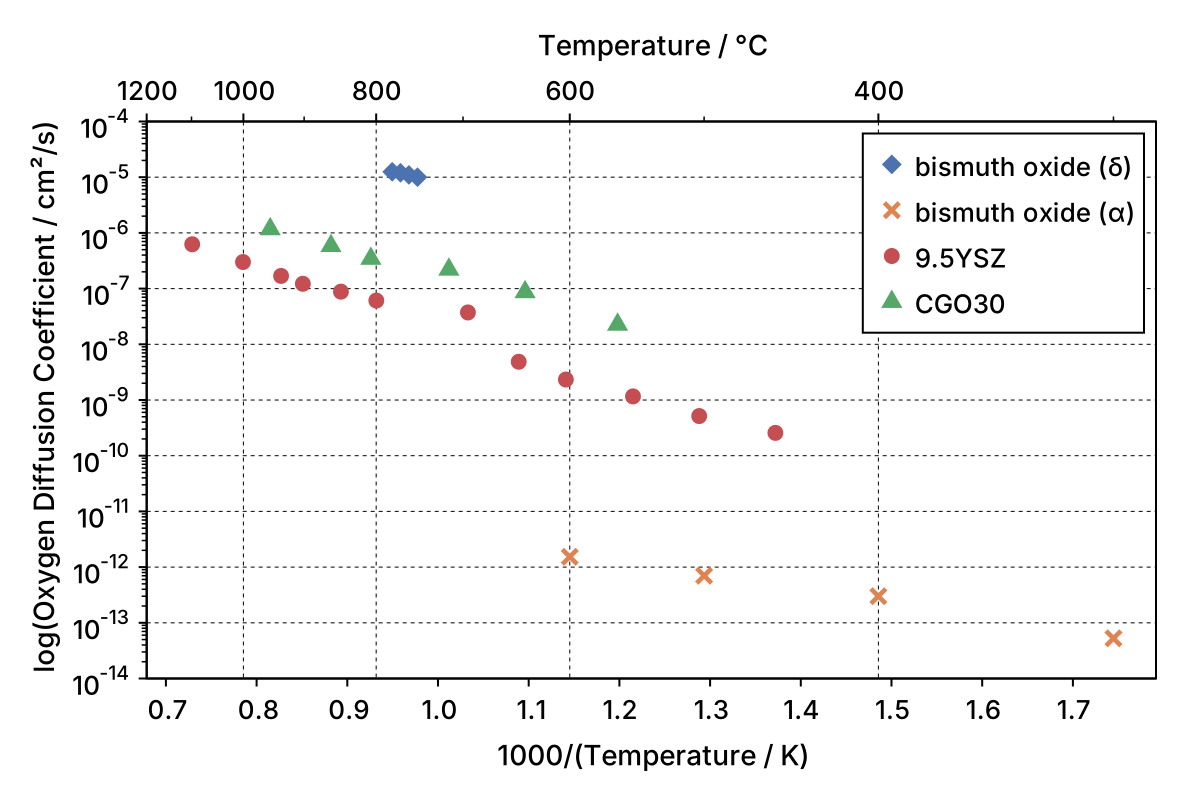
Oxygen diffusivity on a reciprocal temperature scale, with activation energies annotated and each material named in the legend.
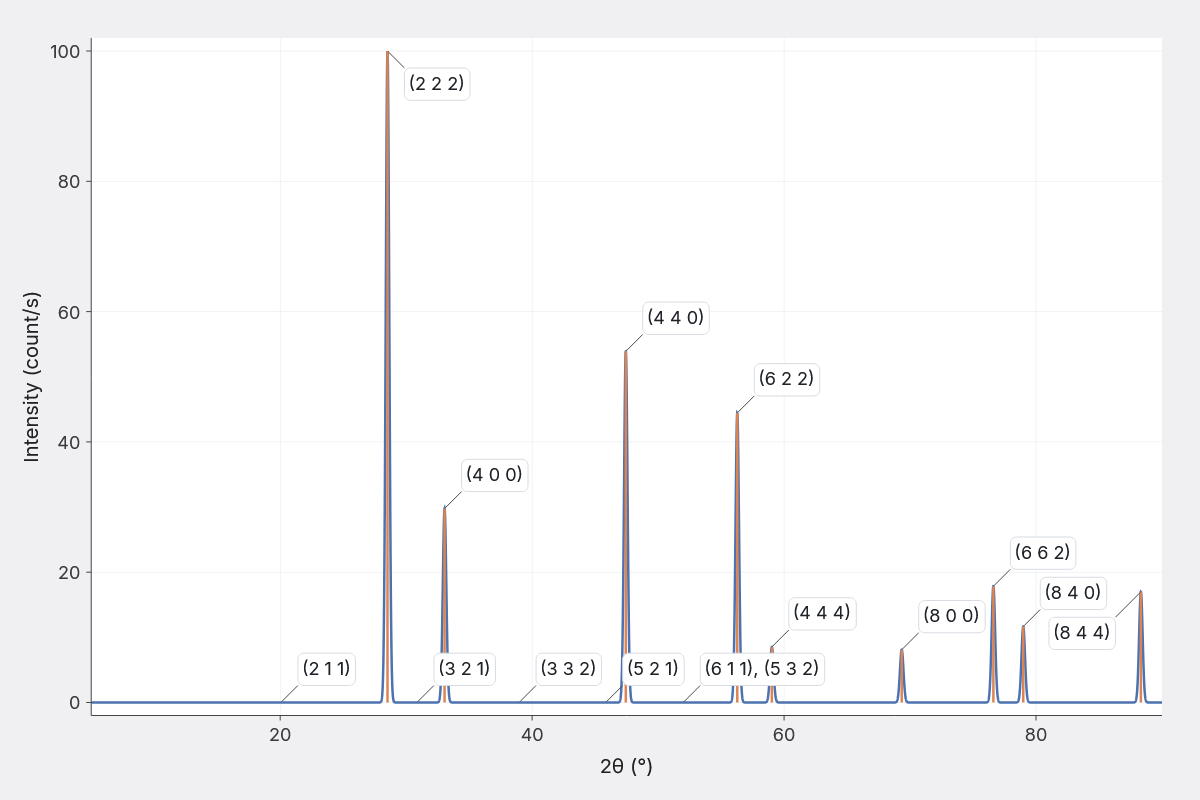
XRD
Indexed diffractogram, with the peaks drawn as a stem series and the Miller indices in a label series.
Reads your raw data, learns your experiment types
DataCNVS reads instrument files directly, whether they're in instrument-specific formats (like TA Instruments' TRIOS JSON and Malvern Panalytical XRDML) or generic formats (like CSV, ASCII, and JSON). There is no export step and no reformatting before you can plot. You tell it once what a column holds, say temperature in degrees Celsius or heat flow in milliwatts, and it keeps that mapping.
The next file of that type arrives already assigned. As your team works, the workspace learns the experiment types your organisation actually runs, so a new starter's first import is as quick as your most experienced user's. Import stops being the slow part.
See the formats we parse today and how mapping works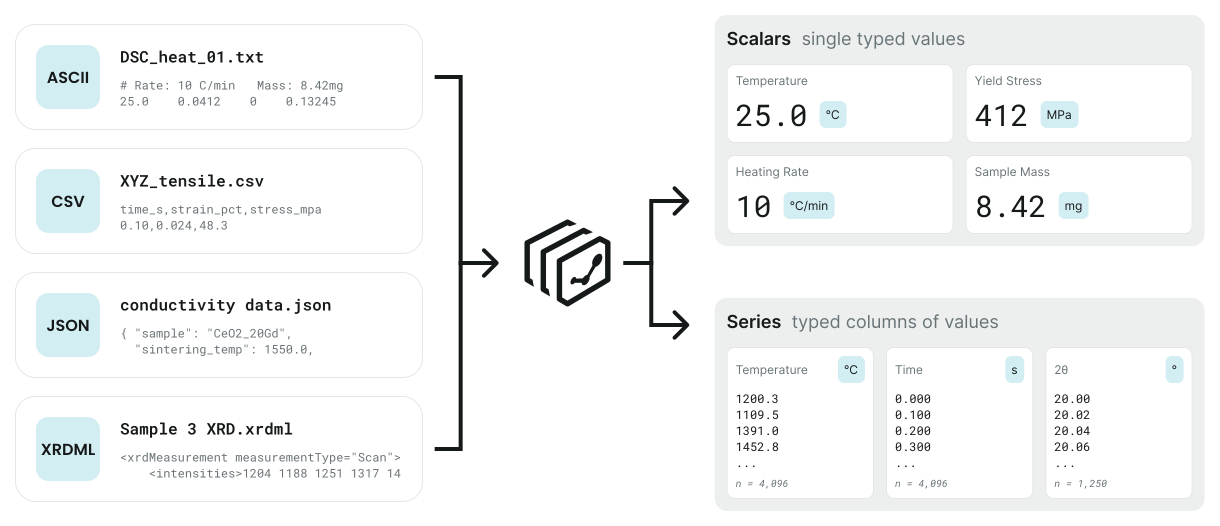
Never mislabel an axis again
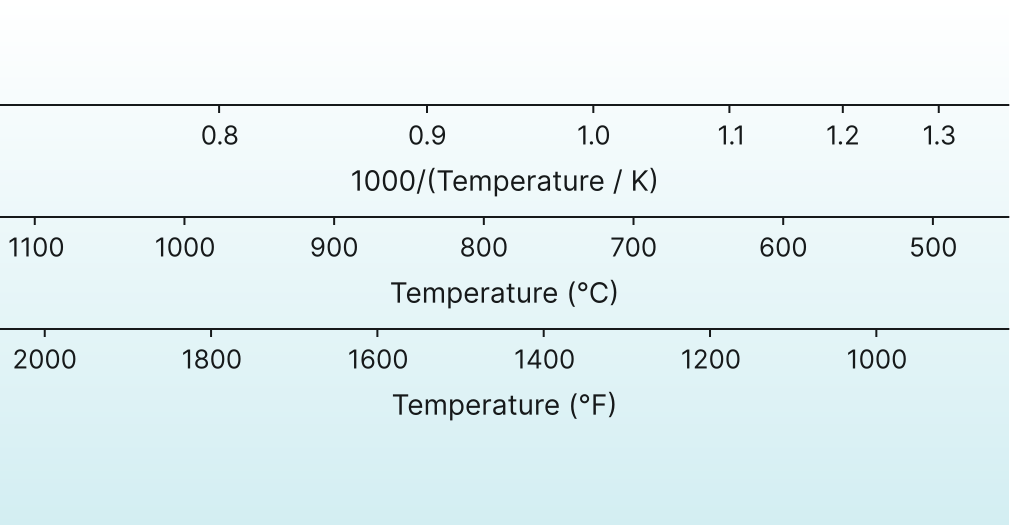
Units are a data type in DataCNVS, not text you typed into a box. The axis labels itself from the data, and stays correct when the data changes.
Convert to kelvin and the label follows. Overlay a run from a different instrument recording in different units and it lands on the same axis, converted properly, rather than silently plotting nonsense.

Publication quality figures
Real vector output in SVG format, sized to the template, with fonts embedded and text that stays text. It opens in whatever software you want if someone downstream needs to touch it, and it stays sharp whether printed on a poster or shown on a giant screen.
The defaults are the point: sensible type scale, proportionate line weights, a palette that survives greyscale printing. You get something presentable before you've adjusted anything, and the adjusting is for taste rather than repair.
One canvas, not four versions spread across slides and documents
Right now the figure gets exported, dropped in a deck, cropped into a doc, and re-exported when the data changes. By the third copy, nobody knows which one is current.
A canvas has one live version. Two people can be in it at once, one adjusting the fit while the other writes the annotation explaining it. Share it as a link and the reader always sees the current state. When the data is revised, you update the canvas, not four documents.
Create a theme and every plot your team produces is consistent
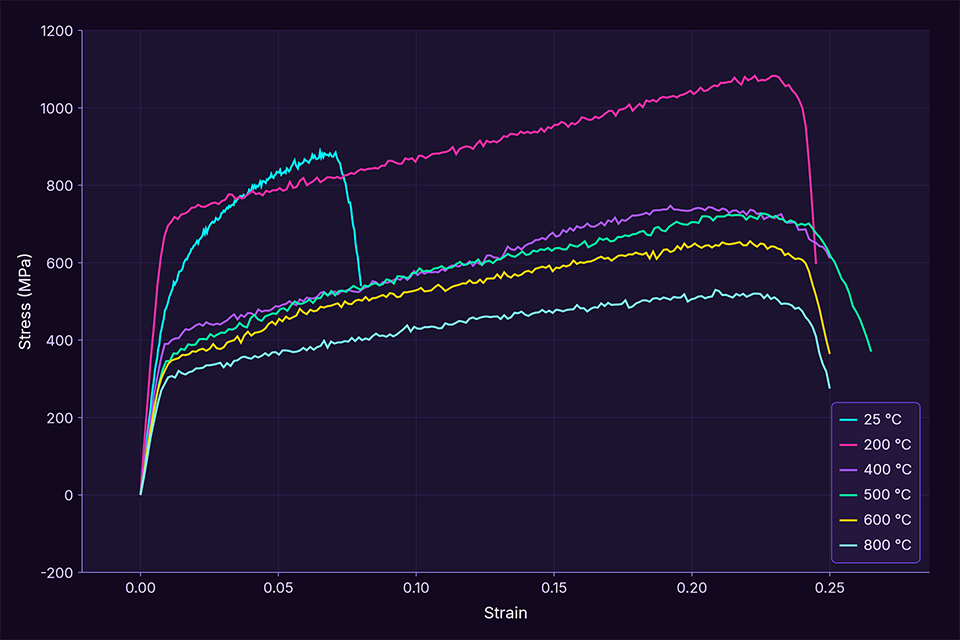
Set the house style once: color palette, axis conventions, line weights, export sizes, greyscale and high-contrast variants. It lives in the workspace, not in a template file on someone's laptop.
Every figure the team makes inherits it, including the first one a new starter produces in their first week. Update the theme and existing figures follow. Consistency stops being something anyone has to review for.
Start free. Add the team when you need it.
Starter
For individual useUnlimited canvases, 3 private canvas shares, 10 private observation shares, and 1 GB of storage.
Start for freeAcademic
For academic teams (valid academic affiliation required)A shared team workspace with unlimited canvas and observation sharing, unlimited public canvas links, and 10 GB of storage per seat.
Get startedTeam
For teams outside academiaThe same shared workspace as Academic, with sharing and public links your admin can toggle off, and 10 GB of storage per seat.
Get startedOrganization
For organizations that need more storage and scaleEverything in Team, plus 100 GB of storage per seat and API access (coming soon).
Contact salesEnterprise
For programs with security and scale requirementsSAML SSO, SCIM provisioning, and custom analysis algorithms, all scoped to your program.
Contact salesYour data, plotted in seconds.
SSO · tenant isolation · nothing to install · see security details